set.seed(1902)
n_nr_obs <- 15
vec_width_random <- rnorm(n_nr_obs, mean = 73, sd = 2.5)
vec_height_random <- rnorm(n_nr_obs, mean = 175, sd = 7.9)
plot(vec_width_random, vec_height_random)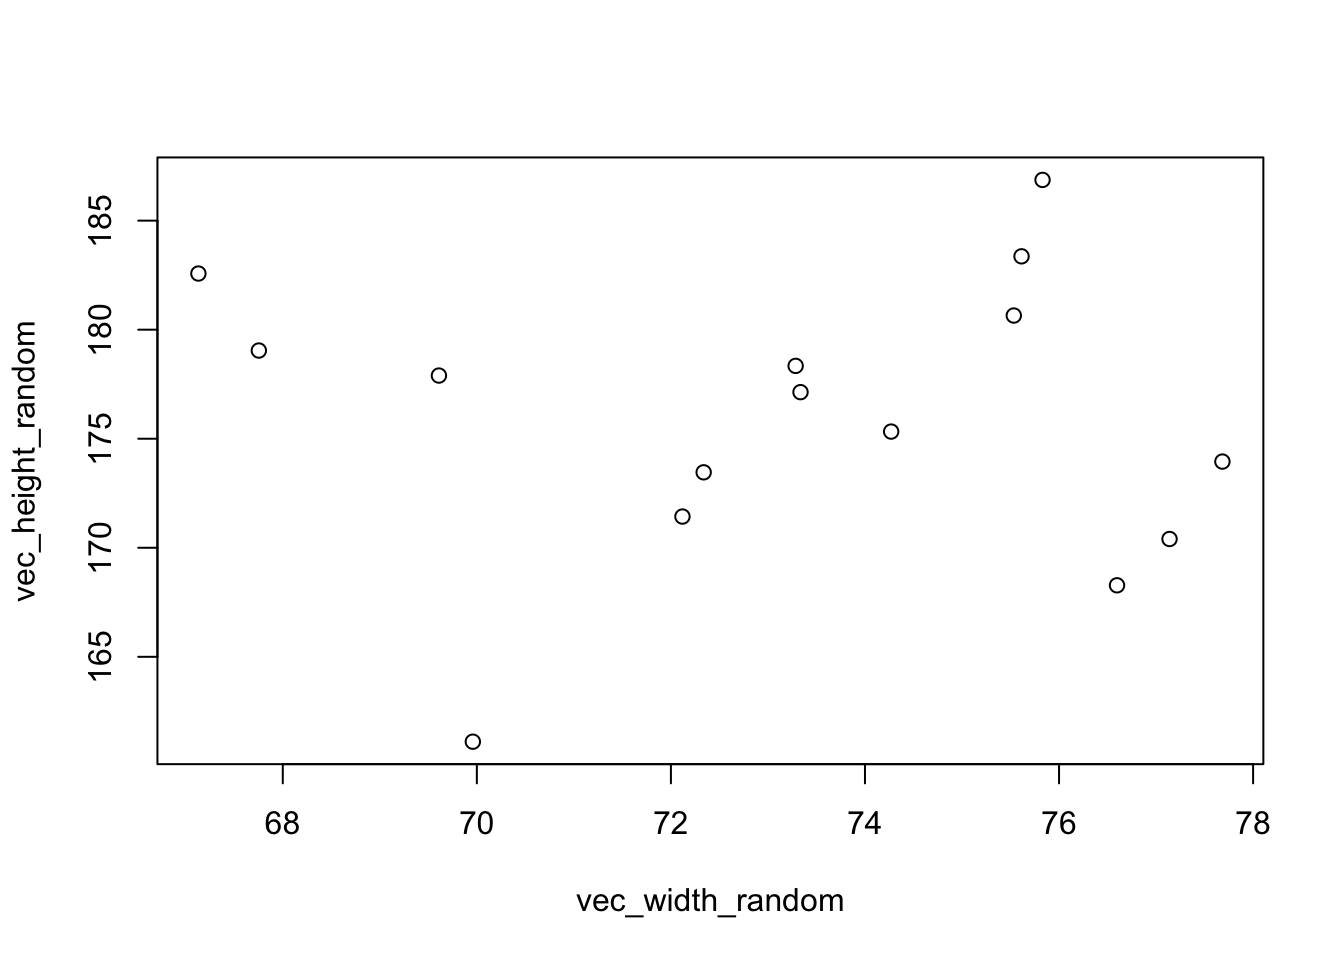
Measure width of your left hand in mm and your height in cm and enter that data into a table. From that table create a simple plot using the function plot(). As a demo, we are first running that with random numbers. After that run the same with the collected data
set.seed(1902)
n_nr_obs <- 15
vec_width_random <- rnorm(n_nr_obs, mean = 73, sd = 2.5)
vec_height_random <- rnorm(n_nr_obs, mean = 175, sd = 7.9)
plot(vec_width_random, vec_height_random)
Do the same with the collected data
Order both variables (width and height) in the data according to the width of the left hand, then repeat the plot
vec_order_random <- order(vec_width_random)
vec_ord_width_random <- vec_width_random[vec_order_random]
vec_ord_height_random <- vec_height_random[vec_order_random]
plot(vec_ord_width_random, vec_ord_height_random)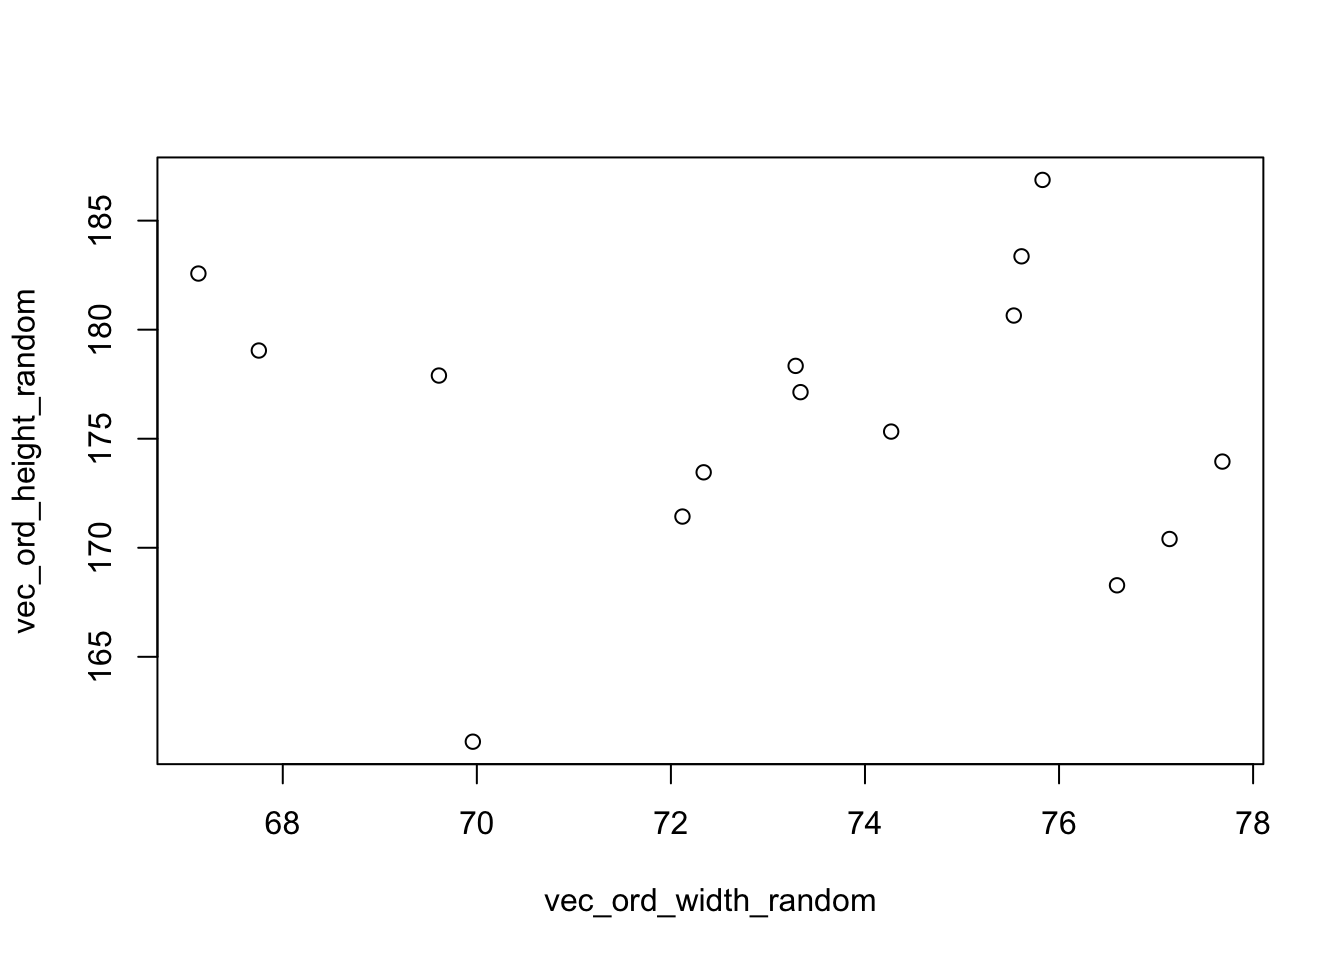
Do the ordered version of the plot
Fitting different lines through the demo
plot(vec_width_random, vec_height_random)
abline(180, 0, col="blue")
abline(170, 0.1, col = "green")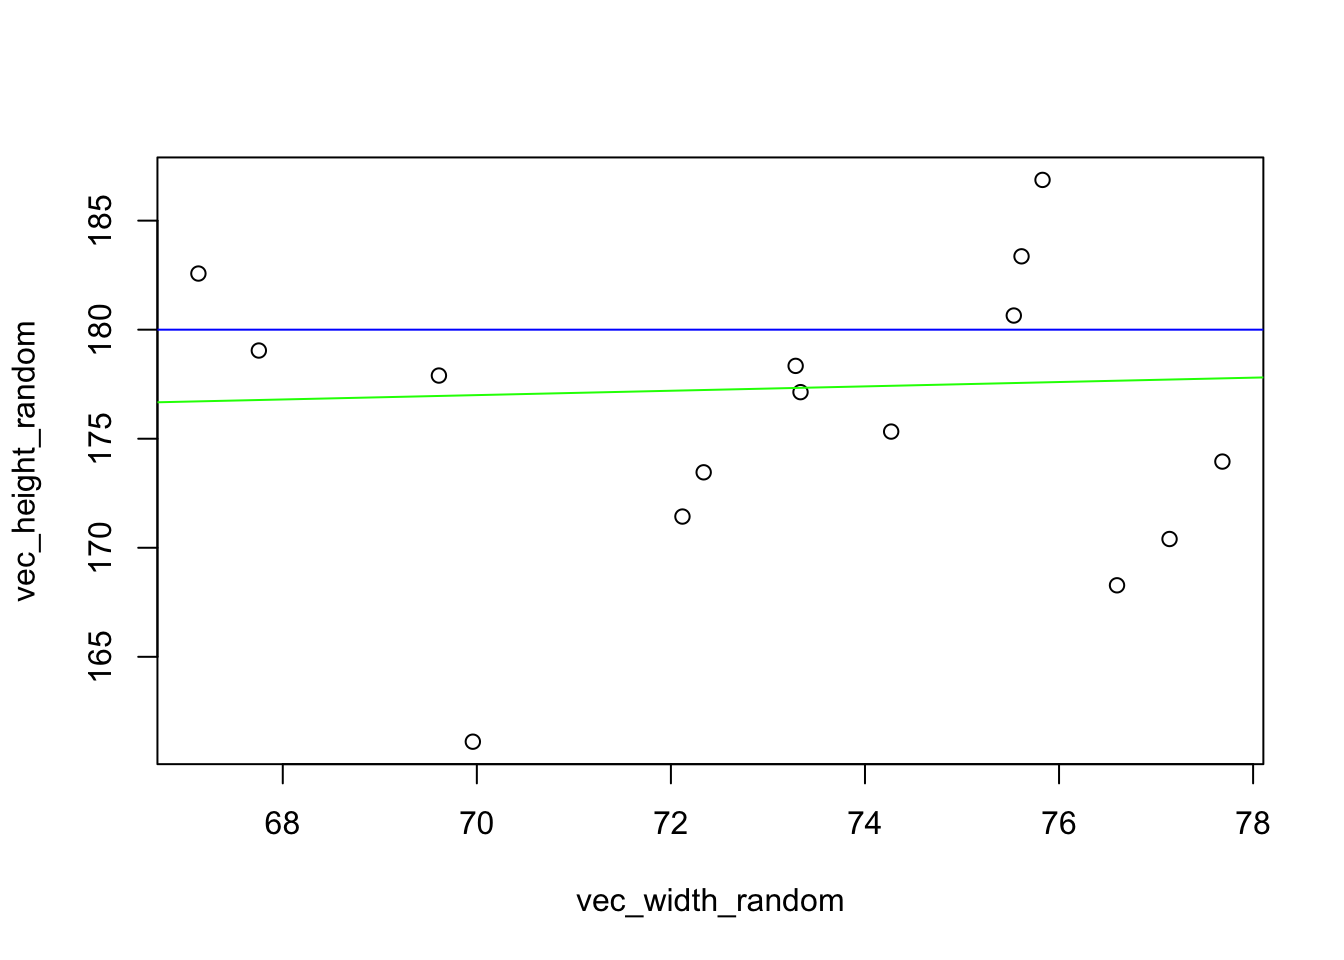
Try to fit some plots for the collected data
Start with blue line
Green line
The following code chunk fits a series of lines and finds the minimum sum of squared residuals